As I reported a couple weeks ago, a slough of recent headlines, peer-reviewed journal articles and news bulletins seem to be crying out a loud and clear warning: 'The Earth is melting!' they warn us and and it's time we start listening...
Those warnings continue to roll in as five new peer-reviewed articles discussing aspects of global climate change appeared in the pages of the last two issues of Science.
Rapid Temperature Increases Above the Antarctic The March 31st issue of Science contains a new study from scientists from the British Antarctic Survey. The study reports "an undocumented major warming of the Antarctic winter troposphere that is larger than any previously identified regional tropospheric warming on Earth" [The troposphere is the lowest layer of the atmosphere]. The study analyzes the recently digitized and "rigourously quality controlled" data from radiosonde weather balloon observations from the last 30 years and reveals that the Antarctic has the same global warming signature as that seen across the whole Earth - but three times larger than that observed globally! The data shows that Antarctic temperatures in the mid-troposphere have increased at a statistically significant rate of 0.5° to 0.7° Celsius per decade over the past 30 years.
Although scientists have been aware of rapid surface warming in the Antarctic Peninsula region for some time, this study has produced the first indications of broad-scale climate change across the whole Antarctic continent.
Dr John Turner, lead author of the study had this to say: "The warming above the Antarctic could have implications for snowfall across the Antarctic and sea level rise. Current climate model simulations don’t reproduce the observed warming, pointing to weaknesses in their ability to represent the Antarctic climate system. Our next step is to try to improve the models."
Green Car Congress reports that daily launches of weather balloons have been carried out at many of the Antarctic research stations since the International Geophysical Year of 1957-8. The balloons carry instrument packages called radiosondes that measure temperature, humidity and winds up to heights of 20 km or more. Recently many of the old radiosonde records have been digitized and brought together in a project funded by the Scientific Committee on Antarctic Research.
The study's analysis of the radiosonde data shows a winter season warming throughout the troposphere, which extends up to about 8 km, and cooling in the stratosphere above. The largest warming of almost 0.75 º C per decade was found close to 5 km above the surface. This is more than three times the rate of warming observed for the world as a whole.
The study finds that the warming is not regionally isolated and has occurred across the whole of the Antarctic. The warming is apparent in the balloon data from Amundsen-Scott Station at the South Pole to the many stations along the coast of East Antarctica.
Although climate change at the surface of the Earth receives wide attention, the atmosphere in recent decades has in fact warmed most some 4-5 km above the surface, with the stratosphere cooling above, GCC reports. There is increasing evidence that levels of greenhouse gases have provided a blanket above the Earth trapping heat at lower levels and giving cooling in the layers above.
Air temperatures in the Antarctic Peninsula region have risen by over 2.5°C in the last 50 years, about 5 times faster than the global mean rate.
End of 21st Century Could See Highest Summer Temperatures in 130,000 Years - Sea Levels Could Rise 20 Feet Two new studies conclude that ice sheets covering both the Arctic and Antarctic could melt more quickly this century than previous studies have predicted, a cause for concern given the potential impact of melting Antarctic and Greenland ice sheets on sea levels.
The two studies, led by scientists at the National Center for Atmospheric Research (NCAR) and the University of Arizona, blend computer modeling with paleoclimate records to show that by the year 2100, Arctic summers may be as warm as they were nearly 130,000 years ago. At that time, sea levels rose to 20 feet (6 meters) higher than they are today!
Bette Otto-Bliesner (NCAR) and Jonathan Overpeck (University of Arizona) based their findings on data from ancient coral reefs, ice cores, and other natural climate records, as well as output from the NCAR-based Community Climate System Model (CCSM), a powerful tool for simulating past, present, and future climates, according to a National Science Foundation (NSF) press release.
The NSF, which provides primary support to NCAR, funded the research. The study also involved researchers from the universities of Calgary and Colorado, the US Geological Survey, and Pennsylvania State University.
The historical data describes a period in Earth’s history characterized by a high level of Arctic warming. Based on that data, the modeling experiments Otto-Bliesner and Overpeck conducted provide important insights about possible future environmental changes in a warmer world that have the potential to significantly alter our natural and man-made environments.
Otto-Bliesner describes his work: "Although the focus of our work is polar, the implications are global. These ice sheets have melted before and sea levels rose. The warmth needed isn’t that much more than present conditions."
The two studies show greenhouse-gas increases over the next century could warm the Arctic by 5-8 degrees Fahrenheit (3-5 degrees Celsius) in summertime. That would put Arctic temperatures about as warm as it was 130,000 years ago, between the most recent ice age and the one before it, the press release reports.
According to Dr. Shawn Marshall, University of Calgary glacialogist and second author on the papers, the difference 130,000 years ago is that the warming was caused by an increase in solar radiation over the Arctic, the result of slight changes in the Earth-Sun orbit, part of a normal cycle that occurs over tens of thousands of years. “This time around the warming is man-made, caused by carbon dioxide emissions, but the effects on Arctic sea ice, permafrost, and icefields are forecast to be similar," Dr. Marshall writes.
Although simulation results depend on the assumptions and conditions of different models, estimates of warming from the CCSM are within the range projected by other climate models, according to the authors.
"Getting the past climate change correct in these models gives us more confidence in their ability to predict future climate change," says Otto-Bliesner.
The CCSM suggests that during the interglacial period, melt water from Greenland and other Arctic sources raised sea level by as much as 11 feet (3.5 meters), Otto-Bliesner says. However, coral records indicate the sea level actually rose 13-20 feet (4-6 meters) or more. Overpeck thus concludes that Antarctic melting must have produced the remainder of the sea-level rise.
These studies are the first to link Arctic and Antarctic melting in the last interglacial period. Marine diatoms and beryllium isotopes found beneath the West Antarctic Ice Sheet indicate parts of the ice disappeared at some point over the past several hundred thousand years.
Overpeck theorizes that the rise in sea levels produced by Arctic warming and melting could have helped destabilize ice shelves at the edge of the Antarctic ice sheet, leading to their collapse. If such a process occurred today, it would be accelerated by global-scale greenhouse-induced warming year round, Overpeck says. In the Arctic, melting would likely be hastened by pollution that darkens snow and enables it to absorb more sunlight.
The two papers appear in the March 24th issue of Science.
Warming Ocean Waters are Melting Ice Worldwide
According to an article by Robert Bindschadler, a glaciologist at NASA’s Goddard Space Flight Center, the pieces to a years-old scientific puzzle have come together to confirm warmer water temperatures are creeping into the Earth's colder areas. Those warm waters are increasing melting and accelerating ice flow in polar areas.
Temperatures collected from ships and buoys showed a warming of all oceans, according to a NASA article. That increase began before satellite sensors detected temperature increases of sea surfaces. Most of the warming was limited to the oceans’ upper 1,000 meters (.62 mile), except in the North Atlantic. In the cold North Atlantic waters, heat penetrated even deeper, the study found. This warming has increased the melting of sea ice in the North Atlantic.
These warm waters are having another effect, which may potentially be of great significance to sea level rise. The study finds that the warming waters are beginning to melt the undersides of the floating fringes of the Greenland ice sheet, even at great depths. It is these fringes that have been holding back vast stores of ice locked up in the Greenland ice sheet, and as this ice has been melting, the glaciers have hastened their flow to the sea.
A recent assessment in the changes in speed and the amount of snow and ice around Greenland confirms a large melting of outflow glaciers and acceleration of ice flow, NASA reports. Three large glaciers, the Kangerdlugssuaq, Helheim and Jakobshavns Isbrae have been melting at a rapid rate over the past several years.  [Image: Jakobshavn Glacier Retreat 2001-2003: Jakobshavn Isbrae holds the record as Greenland's fastest moving glacier and major contributor to the mass balance of the continental ice sheet. Starting in late 2000, following a period of slowing down in the mid 1990s, the glacier showed significant acceleration and nearly doubled its discharge of ice. The following image from the Landsat satellite shows the retreat of Jakobshavn's calving front from 2001 to 2003. Credit: NASA]
Jakobshavns, the largest outlet glacier on Greenland's east coast, has been annually thinning at 15 meters (49.2 feet) since 1997. The other two glaciers have also been thinning. Kangerdlugssuaq at 40 meters (131.2 feet) per year and Helheim at 25 meters per year (82.0 feet), which can't be explained by normal melting. All of these glaciers have also been accelerating. This isn’t just happening in Greenland, scientists are seeing similar behavior in Antarctica as well.
"Deep outlet glaciers around both major ice sheets are accelerating and thinning means warm water has reached them," Bindschadler said. "I see no process to reverse this and expect increased ice sheet discharge to continue and probably to spread with the result being further accelerations to sea level rise."
Some climatologists argue that increased snowfall in a warming Arctic climate will balance out the ice lost through outlet glaciers. Bindschadler concludes, however, that the evidence is clear that increased snowfall predicted in a warmer climate can't possibly keep up with the increased rate of discharge his study finds.
While Bindschadler's article is opinion, it fits previously disconnected pieces of the climate and ice puzzle together and attempts to draw conclusions. The conclusions cannot be verified without new measurements, and NASA is compiling them with satellites like ICESat, NASA reports. ICESat enables scientists to precisely measure changes in the elevation of ice and snow on glaciers and ice sheets as they respond to a changing climate.
Bindschadler's article also appears is in the March 24 issue of Science magazine.
Global Warming Can Cause 'Glacial Earthquakes' in Polar Areas In the last of these five papers, a team from Harvard University and Columbia University report an unexpected offshoot of global warming: “glacial earthquakes” in which Manhattan-sized glaciers lurch unexpectedly, yielding temblors up to magnitude 5.1 on the moment-magnitude scale, which is similar to the Richter scale, a Harvard Gazette article reports.
Glacial earthquakes in Greenland, the researchers found, are most common in July and August, and have more than doubled in number since 2002.
Scientists Göran Ekström and Victor C. Tsai at Harvard and Meredith Nettles at Columbia report on Greenland's glacial earthquakes in a paper which also appears in the March 24th issue of the journal Science.
"People often think of glaciers as inert and slow-moving, but in fact they can also move rather quickly," Ekström says. "Some of Greenland’s glaciers, as large as Manhattan and as tall as the Empire State Building, can move 10 meters in less than a minute, a jolt that is sufficient to generate moderate seismic waves."
According to the Gazette, as glaciers and the snow atop them gradually melt, water seeps downward. When enough water accumulates at a glacier's base, it can serve as a lubricant, causing blocks of ice some 10 cubic kilometers in size to lurch down valleys known as 'outlet glaciers,' which funnel all of Greenland's glacial runoff toward the surrounding sea.
"Our results suggest that these major outlet glaciers can respond to changes in climate conditions much more quickly than we had thought," says Nettles, a postdoctoral researcher at Columbia's Lamont-Doherty Earth Observatory. "Greenland's glaciers deliver large quantities of fresh water to the oceans, so the implications for climate change are serious. We believe that further warming of the climate is likely to accelerate the behavior we've documented."
Although Greenland is not a hotbed of traditional seismic activity associated with the grinding of the Earth's tectonic plates, seismometers worldwide detected 182 earthquakes there between January 1993 and October 2005, the Gazette writes. Ekström, Nettles, and Tsai examined the 136 best-documented of these seismic events, ranging in magnitude from 4.6 to 5.1. The researchers found that all 136 temblors originated at major valleys draining the Greenland Ice Sheet, implicating glacial activity in the seismic disturbances.
Of the 136 earthquakes analyzed, more than a third occurred during the months of July (22 earthquakes) and August (24 earthquakes). By comparison, January and February each saw a total of only four earthquakes between 1993 and 2005. Nonglacial earthquakes in polar regions show no seasonal variability.
Greenland's overall number of glacial earthquakes also increased markedly between 1993 and 2005, the study found. Annual totals hovered between six and 15 through 2002, followed by sharp increases to 20 earthquakes in 2003, 24 in 2004, and 32 in the first 10 months of 2005. A single area of northwestern Greenland, where only one seismic episode was observed between 1993 and 1999, experienced more than two dozen glacial quakes between 2000 and 2005, for example. Polar regions have not experienced increases in nonglacial earthquakes in recent years.
While glacial earthquakes appear most common in Greenland, Ekström, Nettles, and Tsai have also found evidence of glacial earthquakes originating at mountain glaciers in Alaska and at glaciers located in ice streams along the edges of Antarctica.
Ekström, Nettles, and Tsai's work was funded by the National Science Foundation.
Resources:
[A hat tip to Green Car Congress]

Friday, March 31, 2006
More Warnings from a Warming World

Where Does Your Oil Come From?
[Update, 9/17/08: This post still get's a lot of traffic, likely due to a great Google ranking on the search term "Where does our oil come from?" For those of you looking for a more up to date picture of where our oil imports come from, the Center for American Progress has an interactive map of 2007 oil imports by nation here. The overall picture hasn't changed significantly however, so the analysis below still holds... Thanks for checking out WattHead. Stick around and explore over three years of energy news and commentary... -Jesse Jenkins, blogmaster.]
The following is an excellent map illustrating just where all our imported oil comes from. At the end of 2005, US crude oil production stood at only 4.86 million barrels per day (bbl/d), the lowest value in more than 50 years. Natural gas plant liquids and condensate add roughly a couple million bbl/d more to our domestic supply. Still, today's 21 million bbl/d consumption rate clearly FAR outpaces our domestic production and imports fill the gap.
Where do all those imports come from? The map below answers that question: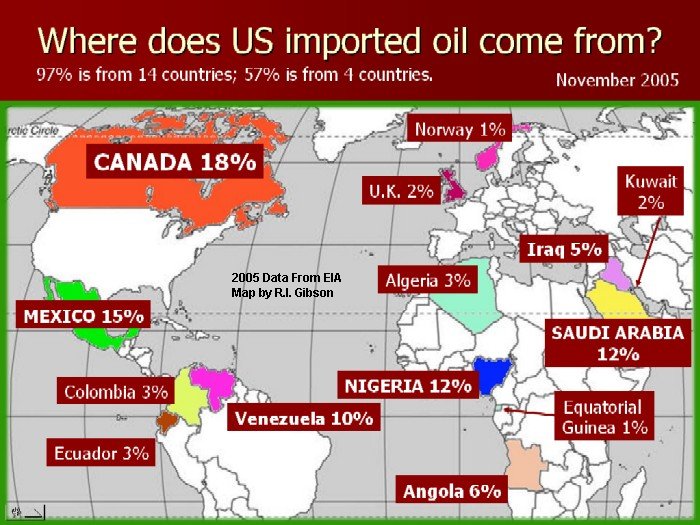
Contrary to the common misconception that most of our oil comes from the Middle East, the map above makes it clear that a third of of our oil comes from our nearest neighbors, Canada (18%) and Mexico (15%). Another 10% of our imports comes from Venezuela with another 3% each coming from Colombia and Ecuador. All together, that means that almost half, or 49% of our imports come from our neighbors in the Western Hemisphere.
The map illustrates another interesting fact: while Saudi Arabia is our third largest source of oil, the African nation of Nigeria comes in tied for third as well, providing us a roughly equal amount of our imports (another 12%).
All in all, only 19% of our imported oil supply came from the Middle East with the breakdown by region as follows:
However, that relatively small figure for the Middle East belies its true importance. Of all those other regions we import from, the Middle East has by far the most sizable reserves of oil left. Production in most of the other exporting countries from which we get our oil are 'past peak' (as is the United States), meaning that it has begun the irreversible decline in production signature of a finite resource tapped at an exponential rate. As existing oil fields decline, the world will turn to new oil fields to pick up the slack and that's where the Middle East comes in...
Saudi Arabia alone posesses roughly a quarter of the world's proven oil reserves, ranking first in the world with 261.7 billion barrels, according to the CIA World Factbook. Canada ranks in at number two with 178.9 billion barrels but the next four are all Middle Eastern countries: Iran (113.3 billion bbl), Iraq (112.5 billion bbl), United Arab Emirates (97.8 billion bbl) and Kuwait (96.5 billion bbl). All together, according to the CIA World Factbook, these five Middle Eastern nations posess 69.5% of the world's proven supply of 1,025 billion barrels!
So, despite the fact that we currently rely on many other countries for our oil supplies and depend on our nearest neighbors for the largest share, that picture will change in the future. Saudi Arabia and the Middle East will become ever more important suppliers of oil as supplies elsewhere dwindle and the oil gluttons of the world turn to fight over the vast reserves of the Middle East (a conflict many believe has already begun).
I have to ask, does this sound like a conflict we really want to get invovled with? Do we really want to compete, either economically or militarily, with rising giants China or India for control over the oil reserves of the Middle East? Is that a confict we can win, and if it is, at what price? Would it not be wiser to invest now in alternatives to our "oil addiction" - the electrification of transport, domestic supplies of renewable electricity and biofuels, energy conservation and efficiency, and probably either coal gasification (with carbon sequestration) or nuclear? I'll leave the answers to you...
[A hat tip to Greg Bothun for the map]
Wednesday, March 22, 2006
Northeast Australia Hit by Category 5 Cyclone
 Green Car Congress relayed news yesterday that Northeastern Australia was hit by one of the most powerful cyclones in decades on Monday [hurricanes are called cyclones 'down undah' for all you American readers].
Cyclone Larry made landfall near Cairns, Queensland, with winds of up to 180 mph (290 km/hr). Larry reportedly flattened sugarcane fields and banana crops, ripped roofs off houses and uprooted trees in a 300km-wide swath (186 miles).
Hardest hit was the town of Innisfail, 60 miles (100 km) south of Cairns. About half the homes in Innisfail have been damaged, according to emergency services, and millions of dollars worth of sugar cane and banana crops have been destroyed, GCC reports.
The area is the heart of Australia’s banana industry and also accounts for 25% of Australia’s sugar cane production. The Austrlian Broadcasting Corporation reports that as much as 90% of the nation's banana crop was lost due to this single storm. Since many trees have been destroyed, it may be many years before the banana industry recovers. Cairns and the surrounding area is also a large tourist destination and departing point for visits to the Great Barrier Reef and Queensland's northern rainforests.
Amazingly, CNN reports that so far there have been no fatalities and that only 30 people suffered minor injuries due to the storm. However, the constant rain dumped in Larry's wake is raising concerns about disease outbreaks including dengue fever and hepatitis because many areas remain without power, running water or sewerage, according to the Australian Broadcasting Corporation. [Image: Cyclone Larry after landfall]
The article continues: The Australian Bureau of Meteorology said Larry was similar in size to Cyclone Tracy, which killed 71 people and destroyed about 70 percent of the northern city of Darwin in 1974.
The Tropical Cyclone Warning Centre in Brisbane is already monitoring Cyclone Wati, currently at category two strength. The storm, still to the east of Cairns, appears to be taking a similar track to that of Larry.
Hurricane Season for the US does not officially begin for another two and one-half months, but Accuweather just forecast that the northeast US coast could be the target of a major hurricane, perhaps as early as this season.
The forecast suggests that in terms of number of storms, the 2006 hurricane season will be more active than normal, but less active than last summer’s historic storm season.
"The Northeast is staring down the barrel of a gun. The Northeast coast is long overdue for a powerful hurricane, and with the weather patterns and hydrology we’re seeing in the oceans, the likelihood of a major hurricane making landfall in the Northeast is not a question of if but when."
—Joe Bastardi, Chief Forecaster
AccuWeather.com Hurricane Center research meteorologists have identified weather cycles that indicate which US coastal areas are most susceptible to landfalls.
"Determination of where we are in the cycle has enabled AccuWeather.com meteorologists to accurately predict hurricane activity in Florida in 2004 and along the Gulf Coast last year. There are indications that the Northeast will experience a hurricane larger and more powerful than anything that region has seen in a long time."
—Ken Reeves, Expert Senior Meteorologist and Director of Forecasting Operations
In a paper published last Friday online in Science, researchers [at] Georgia Tech applied a new methodology to the analysis of global hurricane data and concluded that the increasing trend in the number of category 4 and 5 hurricanes for the period 1970 to 2004 is directly linked to the trend in rising sea surface temperatures (SST).
"...other aspects of the tropical environment, while influencing shorter term variations in hurricane intensity, do not contribute substantially to the observed global trend."
A discussion of the results of this paper and supporting and dissenting views on the conclusion is available here on RealClimate.
Yet another piece of anecdotal evidence and another study indicating that global climate change - in this case its affect on sea surface temperatures - ought to give us cause for concern. Extreme weather related incidents are on the rise and global climate change is the most likely culprit. The insurance agencies are well aware of this fact because they've been paying attention to this:
As the chart illustrates, the United States averaged only about one major weather related disasters costing over $1 billion per year during the 1980s. During the past decade and a half, the number of major storms has jumped to 3-4 per year. Note that the chart does not include 2005's record hurricane season which is likely the worst disaster year on record. Weather related disasters include drought, hurricanes, tornadoes, wild fires and the like.
To me, it isn't surprising that sea surface temperature rises - linked to global climate change - are responsible for the increase in frequency of class 4 and 5 hurricanes/cyclones. That's just the simple physics of it. I guess it just takes a study to make the official case.
Resources:
“Deconvolution of the Factors Contributing to the Increase in Global Hurricane Intensity”; Carlos D. Hoyos, Paula A. Agudelo, Peter J. Webster, Judith A. Curry; Science DOI: 10.1126/science.1123560
Friday, March 17, 2006
New From My Backyard: Oregon Governor Wants State Govt. to Run on 100% Renewable Energy
 Oregon Governor Ted Kulongoski wants 100% of the electricity used by state agencies to come from new sources of renewable energy by 2010, the Oregonian reports.
According to the Oregonian, Kulongoski had previously set the mark at 100 percent by 2025, but decided to greatly accelerate the schedule as a way to create jobs and set an example in responsible energy consumption. Speaking before the Oregon Sustainability Board on March 10th, Kulongoski said, "I want to shorten our timetable by 15 years. I want to do it by 2010, and I think we can do this if we set the bar and say we are going to move toward this target."
“The state must lead by example in its consumption of energy,” Kulongoski said.
So far, the governor has provided little in the way of specifics on public investment costs, potential savings or ways to meet the target but his plan would be a first in the nation for a state government. Kulongoski promised that the state departments of Administrative Services and Energy would deliver options to him by July, the Oregonian reports.
According to the article, the state government currently spends about $26 million a year on electricity, which makes up roughly one-third of the total energy consumed by various state agencies. Currently, only about 1 percent of state agencies' electricity comes from renewable sources, said Anna Richter Taylor, a Kulongoski spokeswoman.
The article continues: Renewable energy and consumer advocates called the governor's proposal feasible. They praised his aggressiveness in developing new industry through wind and solar generators, geothermal or hot rock sources, and plant matter biomass.
That's especially timely as Oregonians worry about global warming and soaring fuel costs, they said. At the same time, there's dwindling room to develop additional sites to generate hydroelectric power.
Wind and solar sources are attractive "because there's no fuel -- nature is the fuel -- you have very stable prices over the long term," said Rachel Shimshak, director of the Renewable Northwest Project, a nonprofit advocacy group.
Bob Jenks, executive director of the consumer-friendly Citizens' Utility Board, said government is poised to encourage demand.
"Twenty years ago, government did a lot to push the purchase of recycled paper and helped build the market for that," he said. "And they can do the same here: use their purchasing power to develop renewable energy."
About 55 percent of regional electricity comes from hydropower dams -- which environmentalists say have threatened to extinguish the Northwest salmon population -- with the rest coming from coal and natural gas, said Angus Duncan, president and CEO of the Bonneville Environmental Foundation, a nonprofit agency that buys and sells renewable energy.
Wind power generates about 1 percent, meaning there's plenty of room to grow, he said.
Kulongoski said possible options include the state buying and developing wind farms, or contracting with a private company to develop one. State agencies also could install more solar panels or build on-site biomass generators.
All of that sounds good to Rep. Jeff Kropf, a Republican from rural Sublimity, who co-sponsored a bill last year to promote renewable fuels made from corn, seeds or other agricultural products.
"As long as it can be developed within the state of Oregon and doesn't cost us more money in the long run," he said, "I'm fine."
This sounds like an excellent plan to me.
As a very large bulk purchaser of electricity, government agencies can do a lot to encourage the adoption of renewable energy. The same rational applies to colleges and universities, more and more of which have made significant green energy purchases in past years.
Large long-term bulk purchasing commitments are the kind of deals renewable energy investors are looking for before they invest in a new development project.
This state green power purchase would go a long way to spur the development of the renewable energy industry in Oregon and would certainly require the construction of more renewable energy facilities in the state.
I'm skeptical, however, that Kulongoski can actually implement this plan. He has made similar vocal commitments in the past to combat climate change and air pollution through renewable fuels and energy and has been trying to implement California's stricter vehicle emissions standards (which include CO2 standards). However, his term in office is nearing its end (and there's no garauntee he will win his bid for reelection) and so far, none of these measures have actually been implemented.
I applaud Kulongoski for his bold plans and vocal support of renewable energy and stricter vehicle emissions standards. But Ted, let's see some of these plans implemented!
Tuesday, March 14, 2006
ANWR Update - If at First You Don't Succeed ... They're at it AGAIN!
 Clearly, the pro-drilling advocates are firm believers in the maxim, 'if at first you don't succeed, try, try again.' Language that would open the Arctic National Wildlife Refuge for oil and gas exploration has found its way into yet another piece of legislature - this time, the Fiscal Year (FY) 2007 Budget Bill.
Last Friday, the Senate Budget Committee under Chairman Judd Gregg (R-NH) voted 11-9 to include ANWR legislation in the FY 2007 Budget mark-up. Senator Dominici (R-NM) and Senator Stevens (R-AK) drafted language for Chairman Gregg to include $3 billion in revenue from ANWR lease sales in the national budget between 2007-2011, according to ANWR.org. President Bush's proposed ’07 Budget, includes $7 billion in ANWR lease revenues within the first 5 years.
The Senate is schedule to hear vote on the 07 Budget on Wednesday, so little time remains to act, once again, to oppose drilling in ANWR.
The ANWR language was attached to the Budget Bill because budgets are immune to filibuster. That means that only a simple majority is necessary to pass the budget and the ANWR drilling language along with it, rather than the 60 votes required to overcome a threatened filibuster.
Sen. Stevens and his pro-drilling cohorts attempted to include ANWR language in the '06 Budget Bill last year, but their attempts failed when moderate Republicans aligned with most of the Senate Democrats to oppose the bill while it included the ANWR language [see previous post and many more linked from that post].
Undaunted, Stevens attempted to slip his ANWR language through with the Defense spending bill in December hoping that the must-pass bill and the impending holiday recess would rush the Senate into passing his legislation [see previous post]. This attempt failed as well when Senate Republican leadership were unable to secure the 60 votes necessary to avoid filibuster.
This time though, they may have a better chance at it. As ANWR.org reports: "Comments from politicians in the last few weeks have indicated that ANWR legislation will have a much easier time in the budget reconciliation process if not bogged down by other controversial issues and be able to be listed as a stand alone measure. Last year's removal of ANWR language in the '06 Budget was blamed on conflict with too many other controversial issues such as Medicaid and Katrina relief."
Still, Senate Democrats have vowed to once again oppose drilling in ANWR. As Planet Ark reports, no matter how much revenue ANWR leases generate (be it $3 billion or $7), "most Senate and House Democrats are against opening the refuge to oil companies."
All nine Democratic members of the Senate Budget panel wrote a letter to Budget Committee's Republican chairman, Sen. Gregg, making their opposition clear and saying, "It is irresponsible to base the country's budget on highly speculative and dubious projections of lease revenues for the coastal plain of the Arctic National Wildlife Refuge."
"We encourage you to reject any requests that are intended to misuse the budget process to open the refuge to oil and gas drilling and exploration," the Democratic lawmakers said.
And the Democracts aren't alone in their opposition. Last week, 24 House Republicans sent a letter to Republican Rep. Jim Nussle, the chairman of the House Budget Committee chairman, urging him to keep Arctic refuge drilling out of the 2007 budget bill, Planet Ark reports.
Wednesday's vote will be the beginning of a long process. Last year, pro-drilling factions waited until the budget reconciliation process to attach drilling language. That started in late October and the battle over ANWR and the budget lasted through to December.
Still, let's nip this one in the bud and make sure that the Senate strikes the ANWR langauge this Wednesday. Act now to oppose ANWR one more time! Write or call your senators. If the pro-drilling faction is relentless, our opposition to their repeated efforts must be relentless as well.
In light of last week's oil spill at Prudhoe Bay, the North Slope's largest ever, it is clear that drililng in ANWR will not have the light environmental footprint that drilling proponents claim. And if America is addicted to oil, drilling in ANWR is not where we want to be headed!
Monday, March 13, 2006
Alaska's North Slope Sees Largest Oil Spill in History
 Alaska officials said on Friday that a broken pipeline at the Prudhoe Bay oil fields on Alaska's North Slope spilled up to 267,000 gallons (6,357 barrels) of crude oil, making it the largest oil spill ever recorded on the state's North Slope, according to a Reuters report.
At least 201,000 gallons (4,785 barrels) spilled at Prudhoe Bay, the largest U.S. oil field, according to officals at the Alaska Department of Environmental Conservation (DEC). The oil spill covered over 1.9 acres of snowy tundra and the extent of the environmental impact remains unknown, according to Leslie Pearson, on-scene coordinator for the DEC.
The spill was discovered on March 2 on the west side of Prudhoe Bay by a worker for field operator BP Exploration (Alaska) Inc., Reuters reports.
According to the report, officials expect cleanup efforts to take four to six weeks. So far, 52,920 gallons (1,260 barrels) of oil had been recovered, according to a news release issued by a state, federal and BP joint emergency response team. The Reuters report continues:
"Although it is a significant spill and it is a large volume, the footprint, being just under two acres, is small," said Pearson.
Alaska's biggest oil spill was the 11 million-gallon Exxon Valdez disaster of 1989. Crude oil from the grounded Exxon tanker spread to 1,300 miles of coastline, including sites in the Chugach National Forest and in three national park units.
The Prudhoe Bay spill forced BP to shut down operations at a gathering center, a facility that separates pumped oil from water and natural gas, and at the approximately 230 wells that feed into it.
The shutdown caused BP to lose about 100,000 barrels of daily production, although the company has been able to divert production of about 5,000 of those barrels through a different pipeline, BP spokesman Daren Beaudo said.
The Prudhoe Bay field normally produces about 470,000 barrels a day, a little more than half of all North Slope oil output. Other major owners of the field unit are ConocoPhillips and Exxon Mobil. "Knowing the impact area and getting it cleaned up, to us, is in a sense the most important thing," said Beaudo, who added that restarting production is less of a priority.
Officials suspect corrosion created a quarter-inch hole in the transit line and the ensuing leak, even though BP said the area of the breach was not registered as vulnerable as part of the company's corrosion-monitoring program.
Opponents of Arctic National Wildlife Refuge oil development said the Prudhoe Bay spill weakens claims that drilling and other operations could be conducted safely.
"By nature, the oil industry is a messy business," said Luci Beach, executive director of the Gwich'in Steering Committee, a group of Athabascan Indians opposed to oil development in the refuge.
Beach, who was in Washington, D.C., to campaign against Congressional attempts to allow drilling in the refuge, said she often encounters arguments that modern oil-field technology has eliminated environmental risks.
"Look at this huge spill. It kind of takes the air out of that argument," she said.
While an oil spill on water, like the Exxon Valdez, is much worse than an oil spill on land - afterall, oil on water spreads out quickly like, well, oil on water - a spill like this is not without its impacts. As the end of the report points out, events like this kind of provide the perfect counter argument to claims by drilling advocates that opening up ANWR to oil exploration will have a minimal environmental footprint. The pipeline and drilling infrastructure will only impact a small area of the land and modern drilling techniques prevent harmful oil spills, they say.
Well, this oil spill sure seems to contradict the latter part of that claim. This seemed to happend rather unexpectedly to BP whose efforts to spot and avoid potential spills caused by pipeline corrosion completely failed to find and prevent this spill, the largest in North Slope history. Somehow that doesn't make me too confident that drilling in ANWR can takeplace without similar environmental damage.
[A hat tip to Treehugger]
Sunday, March 12, 2006
The Planet is Melting - When Will We Wake Up and Listen?!
 Several recent headlines ought to give us all pause. 'The Earth is melting!' they tell us, but are we listening? If we were, we would be crying out, it's time to start fighting global warming, for it may already be nearing the point where it is too late...
The Arctic is Melting
The first in this series of frightening headlines is a reprise of the news that prompted the first post here at Watthead: a new study of the Arctic permafrost confirms the previous warnings this summer from Russian and American researchers that increasing temperatures in the Arctic are melting vast tracts of Arctic permafrost, threatening sea level rise and the release of huge quantities of methane currently locked in the frozen ground. The study forecasts that global warming will thaw and shrink the total area of perennially frozen ground 60 to 90 percent by 2100, according to Discovery News. To give you a sense of scale, the area of permafrost lost by 2100 could match or exceed the total land area of Australia!
The melting of arctic permafrost on this scale will increase the freshwater run-off into the Arctic Ocean by 28 percent and upset ecosystems over wide areas, according to the study. Even more scary though, is that it will also lead to the release of vast doses of greenhouse gases, currently locked up as methane in the frozen ground.
The warnings this summer called attention to an area of Siberian permafrost spanning a million square kilometers - the size of France and Germany combined - that has recently started to melt for the first time since it formed at the end of the last ice age, 11,000 years ago. This portion of the melting Arctic alone, "which covers the entire sub-Arctic region of western Siberia, is the world's largest frozen peat bog and scientists fear that as it thaws, it will release billions of tons of methane, a greenhouse gas 20 times more potent than carbon dioxide, into the atmosphere."
This melting permafrost scenario is exactly the kind of 'tipping point' scenario that climate scientists fear - a delicate threshold where a slight rise in the Earth's temperature can cause a dramatic change in the environment that itself triggers a far greater increase in global temperatures. Increasing Arctic temperatures melt permafrost, releasing billions of tons of methane, rapidly accelerating regional as well as global warming trends. And once this methane gets out of the soil, there's no putting it back. As the Guardian article from this summer makes clear:Climate scientists yesterday reacted with alarm to the finding, and warned that predictions of future global temperatures would have to be revised upwards.
Melting permafrost spawns another smaller feedback scenario: as permafrost thaws, it reveals bare ground which warms up more quickly than ice and snow, and so accelerates the rate at which the permafrost thaws.
"When you start messing around with these natural systems, you can end up in situations where it's unstoppable. There are no brakes you can apply," said David Viner, a senior scientist at the Climatic Research Unit at the University of East Anglia.
"This is a big deal because you can't put the permafrost back once it's gone. The causal effect is human activity and it will ramp up temperatures even more than our emissions are doing."
Greenland's Glacier Loss Accelerating The next headline involves the glaciers of Greenland. According to a recent study published in Science, the amount of ice that Greenland's glaciers dump into the Atlantic Ocean has almost doubled in the last five years because glaciers are moving faster. The study is the first to incorporate recent changes in glacier velocity into estimates of the overall mass of ice being lost for nearly all of Greenland.
Rising surface air temperatures appear to be culprit, causing the increases in glacier speed in the southern half of Greenland, according to the authors of the study. This study's conclusions imply that many estimates of Greenland’s future contributions to sea-level rise could be too low.
According to the study's author, Eric Rignot or the Jet Propulsion Laboratory: "The behavior of the glaciers that dump ice into the sea is the most important aspect of understanding how an ice sheet will evolve in a changing climate. It takes a long time to build and melt an ice sheet, but glaciers can react quickly to temperature changes."
Over the past 20 years, air temperatures in southeast Greenland have risen by 3º Celsius. According to the authors of the study, the warmer temperatures increase the amount of melt water reaching the glacier-rock interface where it then serves as a lubricant that accelerates glaciers’ flow towards the ocean.
Including the increased glacier speeds, the authors calculate that Greenland contributes about 0.5 millimeters per year to global sea level rise, more than two-thirds of which are the result of the faster glacier speeds. Greenland's glacier melt thus contributes over 16% of total global sea level rise, which currently stands at 3 millimeters per year. [See this Green Car Congress article for more]
The Antarctic Ice Sheet is Losing Mass Yes, that's right, not being one to let it's cousin to the North show it up, the Antarctic has begun melting as well. According to a new study performed by researchers at the University of Colorado at Boulder, the Antarctic ice sheet, which harbors 90 percent of all the Earth’s ice, has lost significant mass in recent years, most of it coming from the West Antarctic ice sheet.
The study's findings are particularly significant because they contradict the predictions of the most recent Intergovernmental Panel on Climate Change assessment, completed in 2001, which projected that the Antarctic ice sheet would in fact gain mass in the 21st century due to increased precipitation in a warming climate.
According to researchers from the British Antarctic Survey, the melting of the West Antarctic ice sheet alone, which is about eight times smaller in volume than the East Antarctic ice sheet, would raise global sea levels by more than 20 feet! Such an event would clearly constitute a global disaster and represents one of the worst of the possible 'nightmare' Global Climate Change scenarios. The possible deglaciation of that polar ice sheet as well as that of Greenland, discussed above, are two topics of considerable concern in the recent British report on Avoiding Dangerous Climate Change (see this Green Car Congress post for more).
As GCC points out, Antarctica, the fifth largest continent, is the Earth’s highest, windiest, coldest, and driest land mass. Nearly all - 99.7% - of the frigid continent's surface is covered by a vast ice sheet with an average thickness of two kilometers and a total volume of ~25 million cubic kilometers. Floating ice shelves constitute about 11% of the continent.
[Check out the UC-Boulder press release for an 'enhanced' video podcast discussing the study's ominous findings.]
Warming Arctic Climate Alters Food Chain
Finally, Arctic critters - whales, walruses, seabirds, fish and more - are all struggling to survive the changing climate of the Bering Sea, their northern feeding grounds which have been disrupted, perhaps permanently, by higher temperatures and melting ice, scientists reported this Thursday in the journal Science. The authors of the study, an international research team, concluded that they are witnessing the transformation of an entire ecosystem, not only a concern for those creatures who call the Bering Sea home, but also to Americans as the region is home to almost half of all U.S. commercial fish production.
All in all, the researchers said, the Arctic climate of the northern Bering Sea is in full retreat, yielding to the sub-Arctic system of the south, according to the San Francisco Chronicle.
The changes are "profound" and perhaps irreversible, even if cold weather eventually returns, the researchers said.
According to the Chronicle: Wildlife experts long have worried about the response of single species to the region's fickle weather patterns, which can fluctuate dramatically from one decade to the next. From season to season, they have cataloged puzzling but apparently unrelated die-offs of seabirds, rare algal blooms and odd migration patterns.
Now, after analyzing two decades' worth of wildlife observations, the researchers have tied these previously unexplained die-offs to the climate records which clearly document warmer water currents, rising air temperatures and vanishing ice packs.
Overall, the Arctic is warming at twice the global rate. As a result of such temperature increases, sea ice in the Bering Sea now melts three weeks earlier than in 1997. Last year, Arctic ice retreated further than in 25 years of satellite monitoring, the Chronicle reports.
The researches "put all the pieces of the puzzle together" and found that ecosystems in the Bering Sea, and most likely elsewhere in the Arctic as well, have been thrown into disorder due to increasing sea and air temperatures. As the Chronicle reports: The researchers found that by 2002, Pacific gray whales were fleeing northward to feed in cooler currents, while pink salmon by the millions swarmed into warmer waters the whales had abandoned. Bottom-dwelling species, unable to adapt, were decimated.
As sea ice diminished, breeding grounds for seals were disrupted and populations plummeted. Polar bears started to drown. Walruses, accustomed to diving in the shallows to feed along the sea bottom, found themselves adrift on broken ice floes in waters 6,500 feet deep. The animals starved.
Conclusions Considered individually, each of these recent headlines offer may offer a slight scare to those who are paying attention, but for most, they are likely simply ignored, dismissed as an isolated event, or forgotten in time.
Taken together, however, these headlines, and the dozens of others like them, should make it clear that these are not isolated incidents. Rather, they tell a clear story of a polar regions already feeling the effects of Global Climate Change.
To me, the message is loud and clear: Climate Change is not some far-off concern, merely an issue of eventual concern but one whose arrival is still several decades away, allowing us time to continue to enjoy our fossil-fuel addicted lifestyles while we ponder the best - i.e. the least painful - way to mitigate it's effects. No, the harbingers of Climate Change are already amongst us, and news such as the headlines discussed above ought to remind us that we must begin to act deliberately and rapidly.
Climate Change may not come the day after tomorrow, but neither will it come decades from now, as some assume. For it may already be too late for certain regions, like the Arctic and Antarctic, and the longer we wait to act, the more likely the Earth will pass the next tipping point, hurtling us ever faster along the path towards climactic Global Climate Change.
I've said it before, and I'll say it again, it's time to start fighting global warming, like yesterday, people!
Sorry for the Absence - I'm Back
 I'd like to say sorry to all you regular readers out there (and there's got to be a couple of you, right?!) for my recent absence here at Watthead. Work on my thesis, has been absorbing much of my time lately, as it probably should (it now has an official title though: On the Road to Replacing Oil - Exploring Alternative Transportation Fuels and Energy Sources) .
Additionally, I spent the last week on the road and away from reliable internet access. I headed down to Chico State University in California last Tuesday evening to attend the Western Regional Sustainability Conference. There, my girlfriend, Jenny, and I gave a presentation on our work here at the University of Oregon to institute an optional program that will allow residents of the UO dorms to purchase Green Tags to cover their personal electricity consumption. I then headed on to San Francisco on Thursday for a bit of a visit with family.
I'm back home now and should resume the 'regularly scheduled programming' here at Watthead, assuming my real world commitments don't intrude to much. I hope you stay tuned...