
Cross posted on Climate Central.
This click-able map shows the 104 active nuclear reactors in the Lower-48 states, overlaid with both recent earthquakes and the 15 strongest earthquakes in the region's history. Note that the most powerful earthquake on record, estimated to have measured 9.0 on the Richter scale, shook the Pacific Northwest back in 1700. You can click on each power plant to obtain more information about it, including the type of reactor design.
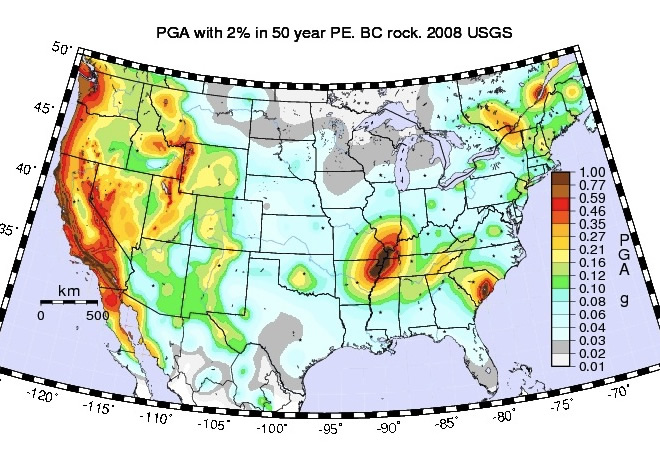
The second (static) map shows the earthquake risk as measured by "Peak Ground Acceleration" or PGA. During an earthquake, the ground shakes back and forth, and the damage is roughly proportional to the ground's maximum acceleration. The map shows the two percent likelihood that the PGA will exceed the shown values in the next 50 years.
Explore the maps, and read on for additional details below.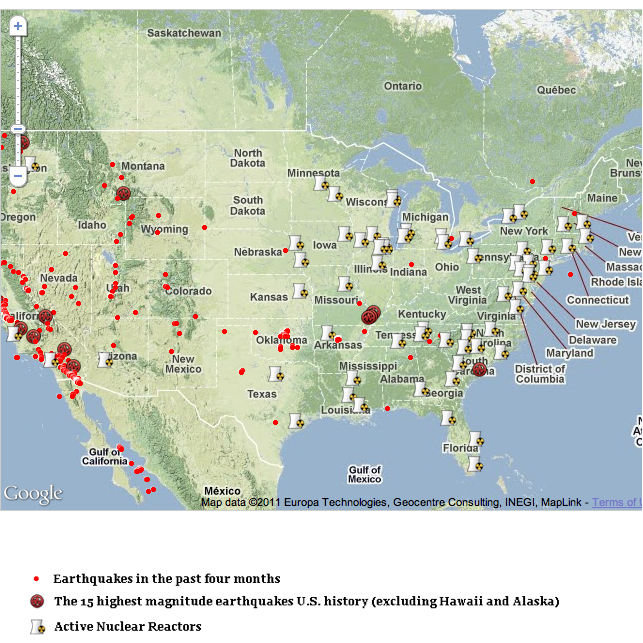
The nuclear crisis following the disastrous 9.0 magnitude earthquake and tsunami in northern Japan continues, and it's raising broader questions about nuclear safety both in and outside of Japan. Many Americans now are asking how vulnerable our country's nuclear facilities are to natural disasters, particularly earthquakes.
Of the reactors in the U.S., about one third of them are boiling water reactors, using the same technology as the Fukushima Daiichi reactor in Japan. In addition, there are eight nuclear facilities located along the seismically active West coast. Twelve of the American reactors that are of the same vintage as the Fukushima Daiichi plant are on seismically active areas around the country.
Unsurprisingly, most of the earthquakes in the contiguous U.S. have occurred in California. But three of the most powerful 15 quakes occurred in Missouri, and another took place in South Carolina. And the strongest ever recorded, estimated to have measured magnitude 9.0, shook the Pacific Northwest back in 1700.
The bottom map above shows the earthquake risk as measured by "Peak Ground Acceleration", or PGA. During an earthquake, the ground shakes back and forth, and the damage is roughly proportional to the ground's maximum acceleration. The map shows the two percent likelihood that the PGA will exceed the shown values in the next 50 years.
In other words, if the map shows that the PGA is 1.0g for a given spot (say, southeast Missouri), that means there is a two percent chance that the peak ground acceleration will be greater than 1.0g at some point in the next 50 years. PGA is measured in "g," with one g being how quickly an object accelerates in free fall (you can also think about "pulling Gs," as in a fighter plane).
The PGA risk is what is typically used to set building codes. Most nuclear power plants are designed to operate under 0.2g PGA, and automatically shut off if the PGA exceeds 0.2g. However, they can withstand a PGA many times larger than that.
The magnitude scale is a measure of the total energy an earthquake releases. This is related to, but not directly proportional to the PGA. For instance, the recent earthquake in Christchurch, New Zealand, recorded a deadly PGA of 2.2g, even though it was "only" a 6.3 magnitude earthquake, while a recent earthquake in Chile, which measured 8.8 magnitude, recorded an acceleration of 0.78g.
If you click on the nuclear power plants on the map at the top, you can see what the 50-year two-percent likelihood PGA is for each power plant.
The following nuclear power plants have a two percent or greater chance of having PGA over 0.15g in the next 50 years:
As the unfolding situation in Japan has demonstrated, ground acceleration is only one concern. In fact, the Fukushima reactor -- which is protected by a thick casing of concrete designed to withstand even a plane crash -- was built to survive an earthquake like the one Japan just experienced, and the peak ground acceleration at the plant on March 11 measured only 0.18g, according to one report. The safety of nuclear reactor design is addressed by "defense in depth," which means multiple back-up systems are installed as precautionary measures. If one safety measure fails, there are several others in place to prevent a nuclear emergency. The Fukushima complex was evidently not sufficiently prepared for the combination of an earthquake and a massive tsunami, and when the waves crashed around the power plant, the cooling system failed, leading to a cascade of problems. Some claim that the reactor design is partially to blame, as well. Whether the events at Fukushima will reveal systemic problems at other plants remains to be seen, but it certainly highlights the need to be somewhat imaginative when planning for the worst-case scenario.
The bottom line is that a major earthquake would probably not result in a nuclear meltdown at the reactors on the above map, but it could present significant engineering challenges. Quantifying the risks, and minimizing them as much as possible, is a key task for everyone involved in the nuclear energy industry.
Alyson Kenward contributed reporting to this article.


2 comments:
This is one of the reasons we need to to modify our energy systems. I'm by no means a fear monger but we've had more than enough warnings and this may be our last opportunity to act.
B.Morgan
Great, informative post David. Thanks for contributing!
Post a Comment